
Subject: SLS
TrueCar Releases Analysis of December Industry Sales
Heading into 2023, more indications that OEMs and Dealers will look to stimulate demand
SANTA MONICA, Calif., Dec. 29, 2022 /PRNewswire/ -- TrueCar, Inc. (NASDAQ: TRUE), the easiest, most efficient and transparent online destination for buying and selling new and used vehicles, expects total new vehicle industry sales to reach 1,275,694 units in December 2022, up 4.5% from a year ago and up about 4% from November 2022, when adjusted for the same number of selling days. This month's seasonally adjusted annualized rate (SAAR) for total light vehicle industry sales is an estimated 13.3 million, up 3% from December 2021. Excluding fleet sales, TrueCar expects U.S. retail deliveries of new cars and light trucks to be 1,096,411 units, about even from a year ago and up about 3% from November 2022.
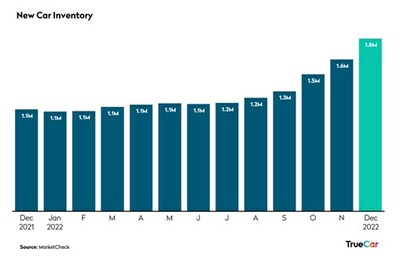
"Sales are on pace to finish higher than a year ago for the fifth consecutive month with inventory improving steadily," said Zack Krelle, Industry Analyst at TrueCar. "As we head into the new year, the industry shows signs of reverting to old customs. Mark-ups (% of sales over MSRP) are being reduced, incentives are inching up and a larger proportion of sales are allocated to rental fleets?all normal indicators after what has been an abnormal few years."
"As inventory continues to build, many OEMs are starting to feel pressure to incentivize, especially with winter storms and rising interest rates keeping more folks on the sidelines," said Justin Colon, Vice President of OEM Solutions at TrueCar.
Additional December Industry Insights (from TrueCar):
- Total sales for December 2022 are expected to be up 4.5% from a year ago and up about 4% from November 2022 when adjusted for the same number of selling days.
- Fleet sales for December 2022 are expected to be up 46% from a year ago and up 8% from November 2022 when adjusted for the same number of selling days.
- Average transaction price for new vehicles is projected to be up 2% from a year ago and up 1% from November 2022.
- Total SAAR is expected to be up 3% from a year ago at about 13.3 million units.
- Used vehicle sales for December 2022 are expected to reach almost 2.5 million, down 10% from a year ago and down 7% from November 2022.
- The average interest rate on new vehicles is 6.7% compared to November 2022 at 6.6% and the average interest rate on used vehicles is 10%.
- The average loan term on a new vehicle for December 2022 is about 70 months and the average loan term on a used vehicle is also about 70 months.
Total Unit Sales | |||||||
Manufacturer | Dec 2022 Forecast | Dec 2021 Actual | Nov 2022 Actual | YoY % Change | YoY % Change | MoM % Change | MoM % Change |
BMW | 41,415 | 42,528 | 36,272 | -2.6 % | -2.6 % | 14.2 % | 5.7 % |
Daimler | 30,124 | 31,932 | 26,777 | -5.7 % | -5.7 % | 12.5 % | 4.2 % |
Ford | 170,471 | 172,257 | 144,984 | -1.0 % | -1.0 % | 17.6 % | 8.9 % |
GM | 219,264 | 163,990 | 196,113 | 33.7 % | 33.7 % | 11.8 % | 3.5 % |
Honda | 95,349 | 105,068 | 79,862 | -9.2 % | -9.2 % | 19.4 % | 10.5 % |
Hyundai | 74,741 | 56,339 | 68,310 | 32.7 % | 32.7 % | 9.4 % | 1.3 % |
Kia | 63,734 | 48,506 | 56,703 | 31.4 % | 31.4 % | 12.4 % | 4.1 % |
Nissan | 68,196 | 77,949 | 60,106 | -12.5 % | -12.5 % | 13.5 % | 5.1 % |
Stellantis | 118,146 | 155,138 | 108,896 | -23.8 % | -23.8 % | 8.5 % | 0.5 % |
Subaru | 58,661 | 51,146 | 50,138 | 14.7 % | 14.7 % | 17.0 % | 8.3 % |
Tesla | 49,536 | 47,253 | 43,453 | 4.8 % | 4.8 % | 14.0 % | 5.6 % |
Toyota | 178,183 | 173,847 | 169,698 | 2.5 % | 2.5 % | 5.0 % | -2.8 % |
Volkswagen Group | 47,919 | 48,011 | 44,170 | -0.2 % | -0.2 % | 8.5 % | 0.5 % |
Industry | 1,275,694 | 1,220,427 | 1,138,281 | 4.5 % | 4.5 % | 12.1 % | 3.8 % |
Retail Unit Sales | |||||||
Manufacturer | Dec 2022 Forecast | Dec 2021 Actual | Nov 2022 Actual | YoY % Change | YoY % Change | MoM % Change | MoM % Change |
BMW | 39,565 | 40,146 | 33,277 | -1.4 % | -1.4 % | 18.9 % | 10.1 % |
Daimler | 27,977 | 29,131 | 24,898 | -4.0 % | -4.0 % | 12.4 % | 4.0 % |
Ford | 123,092 | 133,520 | 108,229 | -7.8 % | -7.8 % | 13.7 % | 5.3 % |
GM | 172,357 | 147,514 | 161,656 | 16.8 % | 16.8 % | 6.6 % | -1.3 % |
Honda | 93,744 | 104,528 | 77,609 | -10.3 % | -10.3 % | 20.8 % | 11.8 % |
Hyundai | 73,688 | 55,609 | 67,517 | 32.5 % | 32.5 % | 9.1 % | 1.1 % |
Kia | 61,880 | 45,531 | 54,797 | 35.9 % | 35.9 % | 12.9 % | 4.6 % |
Nissan | 59,900 | 69,315 | 49,055 | -13.6 % | -13.6 % | 22.1 % | 13.1 % |
Stellantis | 80,191 | 124,423 | 84,468 | -35.5 % | -35.5 % | -5.1 % | -12.1 % |
Subaru | 57,660 | 50,114 | 48,828 | 15.1 % | 15.1 % | 18.1 % | 9.3 % |
Tesla | 41,695 | 46,802 | 36,402 | -10.9 % | -10.9 % | 14.5 % | 6.1 % |
Toyota | 168,019 | 162,816 | 151,795 | 3.2 % | 3.2 % | 10.7 % | 2.5 % |
Volkswagen Group | 43,384 | 47,217 | 40,370 | -8.1 % | -8.1 % | 7.5 % | -0.5 % |
Industry | 1,096,411 | 1,100,321 | 985,025 | -0.4 % | -0.4 % | 11.3 % | 3.1 % |
Fleet Unit Sales | |||||||
Manufacturer | Dec 2022 Forecast | Dec 2021 Actual | Nov 2022 Actual | YoY % Change | YoY % Change | MoM % Change | MoM % Change |
BMW | 1,850 | 2,382 | 2,995 | -22.3 % | -22.3 % | -38.2 % | -42.8 % |
Daimler | 2,147 | 2,801 | 1,879 | -23.4 % | -23.4 % | 14.2 % | 5.8 % |
Ford | 47,379 | 38,737 | 36,755 | 22.3 % | 22.3 % | 28.9 % | 19.4 % |
GM | 46,907 | 16,476 | 34,457 | 184.7 % | 184.7 % | 36.1 % | 26.0 % |
Honda | 1,605 | 540 | 2,253 | 197.4 % | 197.4 % | -28.8 % | -34.0 % |
Hyundai | 1,053 | 730 | 793 | 44.2 % | 44.2 % | 32.8 % | 23.0 % |
Kia | 1,854 | 2,975 | 1,906 | -37.7 % | -37.7 % | -2.7 % | -9.9 % |
Nissan | 8,296 | 8,634 | 11,051 | -3.9 % | -3.9 % | -24.9 % | -30.5 % |
Stellantis | 37,955 | 30,715 | 24,428 | 23.6 % | 23.6 % | 55.4 % | 43.9 % |
Subaru | 1,001 | 1,032 | 1,310 | -3.0 % | -3.0 % | -23.6 % | -29.3 % |
Tesla | 7,841 | 451 | 7,051 | 1640.0 % | 1640.0 % | 11.2 % | 3.0 % |
Toyota | 10,164 | 11,031 | 17,903 | -7.9 % | -7.9 % | -43.2 % | -47.4 % |
Volkswagen Group | 4,535 | 794 | 3,800 | 471.1 % | 471.1 % | 19.4 % | 10.5 % |
Industry | 175,317 | 119,908 | 149,714 | 46.2 % | 46.2 % | 17.1 % | 8.4 % |
Fleet Penetration | |||||
Manufacturer | Dec 2022 Forecast | Dec 2021 Actual | Nov 2022 Actual | YoY % Change | MoM % Change |
BMW | 4.5 % | 5.6 % | 8.3 % | -20.2 % | -45.9 % |
Daimler | 7.1 % | 8.8 % | 7.0 % | -18.8 % | 1.5 % |
Ford | 27.8 % | 22.5 % | 25.4 % | 23.6 % | 9.6 % |
GM | 21.4 % | 10.0 % | 17.6 % | 112.9 % | 21.8 % |
Honda | 1.7 % | 0.5 % | 2.8 % | 227.7 % | -40.3 % |
Hyundai | 1.4 % | 1.3 % | 1.2 % | 8.7 % | 21.4 % |
Kia | 2.9 % | 6.1 % | 3.4 % | -52.6 % | -13.5 % |
Nissan | 12.2 % | 11.1 % | 18.4 % | 9.8 % | -33.8 % |
Stellantis | 32.1 % | 19.8 % | 22.4 % | 62.3 % | 43.2 % |
Subaru | 1.7 % | 2.0 % | 2.6 % | -15.4 % | -34.7 % |
Tesla | 15.8 % | 1.0 % | 16.2 % | 1559.8 % | -2.4 % |
Toyota | 5.7 % | 6.3 % | 10.5 % | -10.1 % | -45.9 % |
Volkswagen Group | 9.5 % | 1.7 % | 8.6 % | 472.2 % | 10.0 % |
Industry | 13.7 % | 9.8 % | 13.2 % | 39.9 % | 4.5 % |
Total Market Share | |||
Manufacturer | Dec 2022 Forecast | Dec 2021 Actual | Nov 2022 Actual |
BMW | 3.2 % | 3.5 % | 3.2 % |
Daimler | 2.4 % | 2.6 % | 2.4 % |
Ford | 13.4 % | 14.1 % | 12.7 % |
GM | 17.2 % | 13.4 % | 17.2 % |
Honda | 7.5 % | 8.6 % | 7.0 % |
Hyundai | 5.9 % | 4.6 % | 6.0 % |
Kia | 5.0 % | 4.0 % | 5.0 % |
Nissan | 5.3 % | 6.4 % | 5.3 % |
Stellantis | 9.3 % | 12.7 % | 9.6 % |
Subaru | 4.6 % | 4.2 % | 4.4 % |
Tesla | 3.9 % | 3.9 % | 3.8 % |
Toyota | 14.0 % | 14.2 % | 14.9 % |
Volkswagen Group | 3.8 % | 3.9 % | 3.9 % |
95.3 % | 96.2 % | 95.4 % | |
Retail Market Share | |||
Manufacturer | Dec 2022 Forecast | Dec 2021 Actual | Nov 2022 Actual |
BMW | 3.6 % | 3.6 % | 3.4 % |
Daimler | 2.6 % | 2.6 % | 2.5 % |
Ford | 11.2 % | 12.1 % | 11.0 % |
GM | 15.7 % | 13.4 % | 16.4 % |
Honda | 8.6 % | 9.5 % | 7.9 % |
Hyundai | 6.7 % | 5.1 % | 6.9 % |
Kia | 5.6 % | 4.1 % | 5.6 % |
Nissan | 5.5 % | 6.3 % | 5.0 % |
Stellantis | 7.3 % | 11.3 % | 8.6 % |
Subaru | 5.3 % | 4.6 % | 5.0 % |
Tesla | 3.8 % | 4.3 % | 3.7 % |
Toyota | 15.3 % | 14.8 % | 15.4 % |
Volkswagen Group | 4.0 % | 4.3 % | 4.1 % |
95.1 % | 96.0 % | 95.3 % | |
ATP | |||||
Manufacturer | Dec 2022 Forecast | Dec 2021 Actual | Nov 2022 Actual | YOY | MOM |
BMW | $69,149 | $63,478 | $68,385 | 8.9 % | 1.1 % |
Daimler | $73,758 | $73,011 | $73,640 | 1.0 % | 0.2 % |
Ford | $55,652 | $50,279 | $54,025 | 10.7 % | 3.0 % |
GM | $52,568 | $53,906 | $52,602 | -2.5 % | -0.1 % |
Honda | $37,299 | $35,275 | $37,127 | 5.7 % | 0.5 % |
Hyundai | $36,967 | $36,144 | $36,420 | 2.3 % | 1.5 % |
Kia | $35,309 | $32,930 | $34,158 | 7.2 % | 3.4 % |
Nissan | $37,140 | $34,790 | $37,125 | 6.8 % | 0.0 % |
Stellantis | $55,362 | $52,025 | $54,813 | 6.4 % | 1.0 % |
Subaru | $35,786 | $34,806 | $35,487 | 2.8 % | 0.8 % |
Toyota | $40,281 | $39,930 | $40,899 | 0.9 % | -1.5 % |
Volkswagen Group | $50,357 | $48,375 | $48,910 | 4.1 % | 3.0 % |
Industry | $45,628 | $44,683 | $45,227 | 2.1 % | 0.9 % |
$945 | $400 | ||||
Incentives | |||||
Manufacturer | Dec 2022 Forecast | Dec 2021 Actual | Nov 2022 Actual | YOY | MOM |
BMW | $1,766 | $2,797 | $1,358 | -36.9 % | 30.0 % |
Daimler | $1,379 | $2,427 | $1,467 | -43.2 % | -6.0 % |
Ford | $1,227 | $2,443 | $1,091 | -49.8 % | 12.5 % |
GM | $1,484 | $1,807 | $1,384 | -17.9 % | 7.2 % |
Honda | $1,000 | $1,586 | $983 | -37.0 % | 1.7 % |
Hyundai | $1,076 | $1,199 | $980 | -10.2 % | 9.8 % |
Kia | $489 | $1,652 | $470 | -70.4 % | 4.0 % |
Nissan | $1,074 | $2,000 | $1,501 | -46.3 % | -28.4 % |
Stellantis | $1,689 | $2,452 | $1,594 | -31.1 % | 6.0 % |
Subaru | $567 | $1,058 | $531 | -46.4 % | 6.7 % |
Toyota | $573 | $1,288 | $611 | -55.5 % | -6.4 % |
Volkswagen Group | $1,704 | $2,097 | $1,488 | -18.7 % | 14.5 % |
Industry | $1,121 | $1,906 | $1,072 | -41.2 % | 4.5 % |
-$785 | $48 | ||||
Incentives as % of ATP | |||||
Manufacturer | Dec 2022 Forecast | Dec 2021 Actual | Nov 2022 Actual | YOY | MOM |
BMW | 2.6 % | 4.4 % | 2.0 % | -42.0 % | 28.6 % |
Daimler | 1.9 % | 3.3 % | 2.0 % | -43.8 % | -6.2 % |
Ford | 2.2 % | 4.9 % | 2.0 % | -54.6 % | 9.2 % |
GM | 2.8 % | 3.4 % | 2.6 % | -15.8 % | 7.3 % |
Honda | 2.7 % | 4.5 % | 2.6 % | -40.4 % | 1.3 % |
Hyundai | 2.9 % | 3.3 % | 2.7 % | -12.2 % | 8.2 % |
Kia | 1.4 % | 5.0 % | 1.4 % | -72.4 % | 0.6 % |
Nissan | 2.9 % | 5.7 % | 4.0 % | -49.7 % | -28.5 % |
Stellantis | 3.1 % | 4.7 % | 2.9 % | -35.3 % | 4.9 % |
Subaru | 1.6 % | 3.0 % | 1.5 % | -47.9 % | 5.9 % |
Toyota | 1.4 % | 3.2 % | 1.5 % | -55.9 % | -4.9 % |
Volkswagen Group | 3.4 % | 4.3 % | 3.0 % | -21.9 % | 11.2 % |
Industry | 2.5 % | 4.3 % | 2.4 % | -42.4 % | 3.6 % |
Revenue | |||||
Manufacturer | Dec 2022 Forecast | Dec 2021 Actual | Nov 2022 Actual | YOY | MOM |
Industry | $58,206,888,261 | $54,531,925,314 | $51,481,485,761 | 6.7 % | 13.1 % |
(Note: This industry insight is based solely on TrueCar, Inc.'s analysis of domestic industry sales trends and conditions and is not a projection of TrueCar, Inc.'s operations.)
About TrueCar
TrueCar is a leading automotive digital marketplace that lets auto buyers and sellers connect to our nationwide network of Certified Dealers. With access to an expansive inventory provided by our Certified Dealers, we are building the industry's most personalized and efficient auto shopping experience as we seek to bring more of the process online. Consumers who visit our marketplace will find a suite of vehicle discovery tools, price ratings and market context on new, used and Certified Pre-Owned vehicles. When they are ready, shoppers in TrueCar's marketplace can connect with a Certified Dealer in our network, who shares our belief that truth, transparency and fairness are the foundation of a great auto shopping experience. As part of our marketplace, TrueCar powers auto-buying programs for over 250 leading brands, including AARP, Sam's Club, Navy Federal Credit Union and American Express.
For more information, please visit www.truecar.com, and follow us on LinkedIn, Facebook or Twitter. TrueCar media email: [email protected]
![]()
SOURCE TrueCar.com
These press releases may also interest you
|
News published on and distributed by:


