
Subject: SLS
TrueCar Forecasts an Increased Industry Sales Pace for November 2021 as Inventory Starts to Rebound
SANTA MONICA, Calif., Nov. 23, 2021 /PRNewswire/ -- TrueCar, Inc. (NASDAQ: TRUE), the most efficient and transparent online destination to find a car, forecasts total new vehicle sales will reach 1,073,042 units in November 2021, down 15% from a year ago and up 14% vs. October 2021, when adjusted for the same number of selling days. This month's seasonally adjusted annualized rate (SAAR) for total light vehicle sales is an estimated 13.7 million, down 12% from November 2020. Excluding fleet sales, TrueCar expects U.S. retail deliveries of new cars and light trucks to be 971,021 units, down 16% from a year ago and up 16% from October 2021.
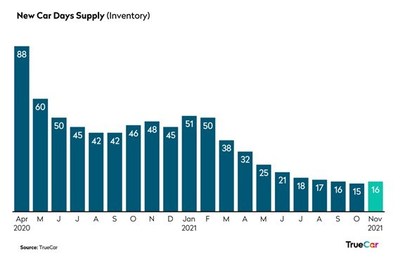
"We continue to see small signs of new vehicle inventory levels rebuilding on dealer lots," said Nick Woolard, Lead Industry Analyst at TrueCar. "However, demand remains strong and continues to push new transaction prices to record levels. Average incentive levels for November are expected to be $1,895 which would be the lowest since 2005 according to Motor Intelligence historical data."
"As expected, we are seeing stronger sales performance for those brands that ramped up production levels in recent months," said Valeri Tompkins, Senior Vice President of OEM Solutions at TrueCar. "Ford in particular is one of the few brands showing gains vs. last year. This is largely driven by new products such as Bronco and Bronco Sport."
Additional Insights (forecast by TrueCar):
- Total sales for November 2021 are expected to be down 15% from a year ago and up 14% from October 2021 when adjusted for the same number of selling days.
- Fleet sales for November 2021 are expected to be down 13% from a year ago and down 1% from October 2021 when adjusted for the same number of selling days.
- Incentive spend is down 50% from last year.
- Average transaction price is projected to be up 9% from a year ago and up 2% from October 2021.
- Total SAAR is expected to be down 12% from a year ago at 13.7 million units.
- Used vehicle sales for November 2021 are expected to reach 3 million, up 2% from a year ago and down 12% from October 2021.
- The average interest rate on new vehicles is 4.3% and the average interest rate on used vehicles is 7.5%.
- The average loan term on a new vehicle for November 2021 is 70 months and likewise the average loan term on a used vehicle is also 70 months.
Total Unit Sales | |||||||
Manufacturer | Nov 2021 Forecast | Nov 2020 Actual | Oct 2021 Actual | YoY % Change | YoY % Change | MoM % Change | MoM % Change |
BMW | 35,178 | 31,005 | 28,231 | 13.5% | 8.7% | 24.6% | 40.2% |
Daimler | 26,030 | 29,580 | 20,081 | -12.0% | -15.7% | 29.6% | 45.8% |
Ford | 165,118 | 148,816 | 174,464 | 11.0% | 6.3% | -5.4% | 6.5% |
GM | 154,096 | 212,415 | 133,168 | -27.5% | -30.5% | 15.7% | 30.2% |
Honda | 86,036 | 102,614 | 97,083 | -16.2% | -19.6% | -11.4% | -0.3% |
Hyundai | 58,582 | 56,106 | 62,061 | 4.4% | 0.1% | -5.6% | 6.2% |
Kia | 40,059 | 47,897 | 52,067 | -16.4% | -19.9% | -23.1% | -13.4% |
Nissan | 63,798 | 72,816 | 59,859 | -12.4% | -16.0% | 6.6% | 19.9% |
Stellantis | 132,664 | 137,913 | 131,496 | -3.8% | -7.8% | 0.9% | 13.5% |
Subaru | 31,731 | 50,413 | 36,817 | -37.1% | -39.7% | -13.8% | -3.0% |
Tesla | 28,394 | 21,650 | 27,137 | 31.2% | 25.7% | 4.6% | 17.7% |
Toyota | 165,367 | 205,523 | 146,670 | -19.5% | -22.9% | 12.7% | 26.8% |
Volkswagen Group | 44,477 | 51,397 | 44,809 | -13.5% | -17.1% | -0.7% | 11.7% |
Industry | 1,073,042 | 1,214,891 | 1,056,866 | -11.7% | -15.4% | 1.5% | 14.2% |
Retail Unit Sales | |||||||
Manufacturer | Nov 2021 Forecast | Nov 2020 Actual | Oct 2021 Actual | YoY % Change | YoY % Change | MoM % Change | MoM % Change |
BMW | 34,613 | 30,494 | 27,745 | 13.5% | 8.8% | 24.8% | 40.3% |
Daimler | 24,984 | 28,634 | 19,670 | -12.7% | -16.4% | 27.0% | 42.9% |
Ford | 133,527 | 119,201 | 141,844 | 12.0% | 7.4% | -5.9% | 5.9% |
GM | 140,486 | 181,998 | 116,069 | -22.8% | -26.0% | 21.0% | 36.2% |
Honda | 85,008 | 102,126 | 96,676 | -16.8% | -20.2% | -12.1% | -1.1% |
Hyundai | 54,632 | 48,565 | 57,426 | 12.5% | 7.8% | -4.9% | 7.0% |
Kia | 34,829 | 43,614 | 50,130 | -20.1% | -23.5% | -30.5% | -21.8% |
Nissan | 58,759 | 68,623 | 49,421 | -14.4% | -17.9% | 18.9% | 33.8% |
Stellantis | 110,376 | 117,599 | 108,813 | -6.1% | -10.1% | 1.4% | 14.1% |
Subaru | 31,526 | 49,733 | 35,444 | -36.6% | -39.3% | -11.1% | 0.1% |
Tesla | 28,229 | 21,650 | 27,128 | 30.4% | 25.0% | 4.1% | 17.1% |
Toyota | 155,633 | 195,915 | 130,055 | -20.6% | -23.9% | 19.7% | 34.6% |
Volkswagen Group | 43,688 | 50,969 | 44,185 | -14.3% | -17.9% | -1.1% | 11.2% |
Industry | 971,021 | 1,102,639 | 941,060 | -11.9% | -15.6% | 3.2% | 16.1% |
Fleet Unit Sales | |||||||
Manufacturer | Nov 2021 Forecast | Nov 2020 Actual | Oct 2021 Actual | YoY % Change | YoY % Change | MoM % Change | MoM % Change |
BMW | 565 | 511 | 486 | 10.5% | 5.9% | 16.3% | 30.8% |
Daimler | 1,046 | 946 | 411 | 10.6% | 6.0% | 154.7% | 186.5% |
Ford | 31,591 | 29,615 | 32,620 | 6.7% | 2.2% | -3.2% | 9.0% |
GM | 13,610 | 30,417 | 17,099 | -55.3% | -57.1% | -20.4% | -10.5% |
Honda | 1,028 | 488 | 407 | 110.8% | 102.0% | 152.4% | 183.9% |
Hyundai | 3,950 | 7,541 | 4,635 | -47.6% | -49.8% | -14.8% | -4.1% |
Kia | 5,230 | 4,283 | 1,937 | 22.1% | 17.0% | 170.0% | 203.8% |
Nissan | 5,039 | 4,193 | 10,438 | 20.2% | 15.2% | -51.7% | -45.7% |
Stellantis | 22,288 | 20,314 | 22,683 | 9.7% | 5.1% | -1.7% | 10.5% |
Subaru | 205 | 680 | 1,373 | -69.9% | -71.1% | -85.1% | -83.2% |
Tesla | 165 | - | 9 | 1683.4% | 1906.3% | ||
Toyota | 9,734 | 9,608 | 16,615 | 1.3% | -2.9% | -41.4% | -34.1% |
Volkswagen Group | 789 | 428 | 624 | 84.3% | 76.6% | 26.4% | 42.2% |
Industry | 102,022 | 112,252 | 115,806 | -9.1% | -12.9% | -11.9% | -0.9% |
Fleet Penetration | |||||
Manufacturer | Nov 2021 Forecast | Nov 2020 Actual | Oct 2021 Actual | YoY % Change | MoM % Change |
BMW | 1.6% | 1.6% | 1.7% | -2.6% | -6.7% |
Daimler | 4.0% | 3.2% | 2.0% | 25.7% | 96.5% |
Ford | 19.1% | 19.9% | 18.7% | -3.9% | 2.3% |
GM | 8.8% | 14.3% | 12.8% | -38.3% | -31.2% |
Honda | 1.2% | 0.5% | 0.4% | 151.4% | 184.8% |
Hyundai | 6.7% | 13.4% | 7.5% | -49.8% | -9.7% |
Kia | 13.1% | 8.9% | 3.7% | 46.0% | 250.9% |
Nissan | 7.9% | 5.8% | 17.4% | 37.2% | -54.7% |
Stellantis | 16.8% | 14.7% | 17.2% | 14.1% | -2.6% |
Subaru | 0.6% | 1.3% | 3.7% | -52.1% | -82.7% |
Tesla | 0.6% | 0.0% | 0.0% | 1604.4% | |
Toyota | 5.9% | 4.7% | 11.3% | 25.9% | -48.0% |
Volkswagen Group | 1.8% | 0.8% | 1.4% | 113.0% | 27.3% |
Industry | 9.5% | 9.2% | 11.0% | 2.9% | -13.2% |
Total Market Share | |||
Manufacturer | Nov 2021 Forecast | Nov 2020 Actual | Oct 2021 Actual |
BMW | 3.3% | 2.6% | 2.7% |
Daimler | 2.4% | 2.4% | 1.9% |
Ford | 15.4% | 12.2% | 16.5% |
GM | 14.4% | 17.5% | 12.6% |
Honda | 8.0% | 8.4% | 9.2% |
Hyundai | 5.5% | 4.6% | 5.9% |
Kia | 3.7% | 3.9% | 4.9% |
Nissan | 5.9% | 6.0% | 5.7% |
Stellantis | 12.4% | 11.4% | 12.4% |
Subaru | 3.0% | 4.1% | 3.5% |
Tesla | 2.6% | 1.8% | 2.6% |
Toyota | 15.4% | 16.9% | 13.9% |
Volkswagen Group | 4.1% | 4.2% | 4.2% |
96.1% | 96.2% | 95.9% | |
Retail Market Share | |||
Manufacturer | Nov 2021 Forecast | Nov 2020 Actual | Oct 2021 Actual |
BMW | 3.6% | 2.8% | 2.9% |
Daimler | 2.6% | 2.6% | 2.1% |
Ford | 13.8% | 10.8% | 15.1% |
GM | 14.5% | 16.5% | 12.3% |
Honda | 8.8% | 9.3% | 10.3% |
Hyundai | 5.6% | 4.4% | 6.1% |
Kia | 3.6% | 4.0% | 5.3% |
Nissan | 6.1% | 6.2% | 5.3% |
Stellantis | 11.4% | 10.7% | 11.6% |
Subaru | 3.2% | 4.5% | 3.8% |
Tesla | 2.9% | 2.0% | 2.9% |
Toyota | 16.0% | 17.8% | 13.8% |
Volkswagen Group | 4.5% | 4.6% | 4.7% |
96.4% | 96.1% | 96.1% | |
ATP | |||||
Manufacturer | Nov 2021 Forecast | Nov 2020 Actual | Oct 2021 Actual | YOY | MOM |
BMW | $55,952 | $57,952 | $57,898 | -3.5% | -3.4% |
Daimler | $61,142 | $57,418 | $62,044 | 6.5% | -1.5% |
Ford | $46,335 | $43,465 | $45,955 | 6.6% | 0.8% |
GM | $49,951 | $43,061 | $49,026 | 16.0% | 1.9% |
Honda | $32,606 | $31,164 | $32,516 | 4.6% | 0.3% |
Hyundai | $33,861 | $30,403 | $33,674 | 11.4% | 0.6% |
Kia | $31,386 | $27,827 | $29,418 | 12.8% | 6.7% |
Nissan | $32,079 | $28,822 | $32,740 | 11.3% | -2.0% |
Stellantis | $49,823 | $44,121 | $48,451 | 12.9% | 2.8% |
Subaru | $31,617 | $30,463 | $30,727 | 3.8% | 2.9% |
Toyota | $36,943 | $34,760 | $37,454 | 6.3% | -1.4% |
Volkswagen Group | $39,104 | $38,248 | $39,198 | 2.2% | -0.2% |
Industry | $41,139 | $37,876 | $40,383 | 8.6% | 1.9% |
$3,263 | $756 | ||||
Incentives | |||||
Manufacturer | Nov 2021 Forecast | Nov 2020 Actual | Oct 2021 Actual | YOY | MOM |
BMW | $3,057 | $5,211 | $2,929 | -41.3% | 4.4% |
Daimler | $3,184 | $4,438 | $2,686 | -28.3% | 18.5% |
Ford | $2,509 | $4,395 | $2,560 | -42.9% | -2.0% |
GM | $1,941 | $4,974 | $2,045 | -61.0% | -5.1% |
Honda | $1,534 | $2,460 | $1,608 | -37.6% | -4.6% |
Hyundai | $1,173 | $2,497 | $1,109 | -53.0% | 5.8% |
Kia | $1,689 | $2,999 | $1,929 | -43.7% | -12.5% |
Nissan | $2,365 | $4,496 | $2,022 | -47.4% | 17.0% |
Stellantis | $2,102 | $4,567 | $2,697 | -54.0% | -22.0% |
Subaru | $878 | $1,505 | $997 | -41.7% | -11.9% |
Toyota | $1,156 | $2,690 | $1,317 | -57.0% | -12.2% |
Volkswagen Group | $2,113 | $4,263 | $2,177 | -50.4% | -2.9% |
Industry | $1,888 | $3,783 | $2,001 | -50.1% | -5.6% |
-$1,895 | -$113 | ||||
Incentives as % of ATP | |||||
Manufacturer | Nov 2021 Forecast | Nov 2020 Actual | Oct 2021 Actual | YOY | MOM |
BMW | 5.5% | 9.0% | 5.1% | -39.2% | 8.0% |
Daimler | 5.2% | 7.7% | 4.3% | -32.6% | 20.3% |
Ford | 5.4% | 10.1% | 5.6% | -46.4% | -2.8% |
GM | 3.9% | 11.6% | 4.2% | -66.4% | -6.8% |
Honda | 4.7% | 7.9% | 4.9% | -40.4% | -4.9% |
Hyundai | 3.5% | 8.2% | 3.3% | -57.8% | 5.2% |
Kia | 5.4% | 10.8% | 6.6% | -50.1% | -17.9% |
Nissan | 7.4% | 15.6% | 6.2% | -52.7% | 19.4% |
Stellantis | 4.2% | 10.4% | 5.6% | -59.2% | -24.2% |
Subaru | 2.8% | 4.9% | 3.2% | -43.8% | -14.4% |
Toyota | 3.1% | 7.7% | 3.5% | -59.6% | -11.0% |
Volkswagen Group | 5.4% | 11.1% | 5.6% | -51.5% | -2.7% |
Industry | 4.6% | 10.0% | 5.0% | -54.1% | -7.4% |
Revenue | |||||
Manufacturer | Nov 2021 Forecast | Nov 2020 Actual | Oct 2021 Actual | YOY | MOM |
Industry | $44,144,026,175 | $46,015,617,012 | $42,679,523,573 | -4.1% | 3.4% |
(Note: This forecast is based solely on TrueCar, Inc.'s analysis of industry sales trends and conditions and is not a projection of TrueCar, Inc.'s operations.)
About TrueCar
TrueCar is a leading automotive digital marketplace that enables auto buyers to connect to our nationwide network of Certified Dealers. We are building the industry's most personalized and efficient auto buying experience as we seek to bring more of the purchasing process online. Consumers who visit our marketplace will find a suite of vehicle discovery tools, price ratings, and market context on new and used cars ? all with a clear view of what's a great deal. When they are ready, TrueCar will enable them to connect with a local Certified Dealer who shares in our belief that truth, transparency, and fairness are the foundation of a great auto buying experience. As part of our marketplace, TrueCar powers auto-buying programs for over 250 leading brands, including AARP, Sam's Club, Navy Federal Credit Union and American Express. TrueCar is headquartered in Santa Monica, California, with an office in Austin, Texas.
For more information, please visit www.truecar.com, and follow us on Facebook or Twitter.
![]()
SOURCE TrueCar, Inc.
These press releases may also interest you
|
News published on and distributed by:


