
S&P 500 buybacks decline in Q1 2019 after four consecutive record quarters; still post 2nd highest quarter ever
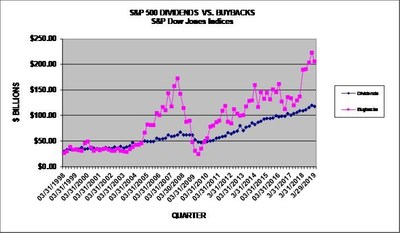
NEW YORK, June 24, 2019 /PRNewswire/ -- S&P Dow Jones Indices ("S&P DJI") announced today that preliminary Q1 2019 S&P 500® stock buybacks, or share repurchases, were $205.8 billion. This ends the streak of four consecutive quarters of record buybacks as Q1 2019 declined 7.7% from the Q4 2018 record of $223.0 billion. The quarter was up 8.9% from the Q1 2018 $189.1 billion, which set a record at the time.
Historical data on S&P 500 buybacks are available at www.spdji.com/indices/equity/sp-500.
Key Takeaways:
- The average share price during the quarter increased 0.8% after Q4 2018's average price decline of 5.3%. Combined with the 7.7% lower buyback expenditures, this resulted in approximately 20% fewer shares repurchased.
- On aggregate, 0.94% of the outstanding shares were repurchased in Q1 2019, down from 1.18% in Q4 2018.
- The cumulative four quarters of repurchases increased the percentage of issues with substantially reduced share counts of at least 4% year-over-year to 24.9%, up from the prior quarter's 18.7% and Q1 2018's 13.6%, giving 1-in-4 issues a strong EPS tailwind.
- S&P 500 Q1 2019 dividends totaled $117.3 billion, down 2.1% from the record setting Q4 2018 of $119.8 billion.
- Total shareholder return of buybacks and dividends for the quarter came in at $323.1 billion, down 5.7% from the record Q4 2018 period expenditure of $342.8 billion, and up 8.4% from the $298.2 billion reported for Q1 2018.
- Total shareholder return for the 12-month period ending March 2019 set a record at $1.288 trillion, up 2.0% from the prior 12-month record in Q4 2018 of $1.263 trillion, and up 28.3% from the $1.003 trillion from the comparable Q1 2018 12-month period.
"Despite the quarterly decline, companies continued to buy back shares in earnest, posting the second highest expenditure on record," said Howard Silverblatt, Senior Index Analyst at S&P Dow Jones Indices. "With Q2 2019 currently projected to be another strong buyback quarter, investors will need to start separating EPS growth in two categories ? actual growth vs. growth from share count reductions. You don't want to pay the same multiple for buybacks as you do for growth."
Silverblatt also found that buybacks continue to be top heavy, with the top 20 issues accounting for 51.2% of the buybacks. For the 12-months ending March 2019, the top 20 issues represented 41.4% of all buybacks, compared to 36.1% for the 2018 period. On an issue level, 389 issues reported buybacks for Q1 2019, down from 404 in Q4 2018 and 397 in Q1 2018. For the 12 months ending March 2019, 442 issues reported buybacks compared to 431 for the comparable 2018 period.
Q1 2019 GICS® Sector Analysis:
Information Technology buybacks continued to dominate as they increased 10.9% to $68.0 billion compared to $61.3 billion for Q4 2018. Twelve-month expenditures were up 82.9% to $282.1 billion from $154.8 billion spent for the same period in 2018. The sector represents 33.0% of the index's buybacks for the quarter, up from 27.5% for Q4 2018.
Energy buyback expenditures continued to decline, falling 50.6% to $4.3 billion compared to $8.7 billion for Q4 2018. Energy spent $13.1 billion five years ago in Q1 2014.
Consumer sectors continued to split as Consumer Discretionary buybacks decreased 30.9% to $17.7 billion, down from $25.7 billion for Q4 2018; in the 12-months ending in Q1 2019, buybacks were $85.7 billion, down 0.4% from $86.1 billion. Consumer Staples increased 2.1% to $9.8 billion, up from $9.6 billion for Q4 2018; for the 12-month period they were down 17.2% to $36.0 billion from $43.6 billion.
Issues:
The five issues with the highest total buybacks for Q1 2019 are:
- Apple (AAPL) again led in buybacks spending a new record $23.8 billion in Q1 2019, up from $10.1 billion spent for Q4 2018. Apple holds 8 of the 10 records for quarterly buybacks, spending $75.1 billion on buybacks over the past year, $234.7 billion over the last five-year period, and $284.3 billion over the last 10-year period.
- Oracle (ORCL): $10.0 billion for Q1 2019, a tick up from their Q4 2018 expenditure; in the last 12 months they spent $35.3 billion, up from $7.4 billion.
- Pfizer (PFE): $8.9 billion for Q1 2019, up from the $5.0 billion spent in Q4 2018; in the last 12-months they spent $15.0 billion, up from $6.1 billion.
- Bank of America (BAC): $6.3 billion for Q1 2019, up from $5.2 billion for Q4 2018; in the last 12-months they spent $21.5 billion, up from $14.9 billion.
- Cisco Systems (ORCL): $6.1 billion for Q1 2019, up from $5.2 billion for Q4 2018; in the last 12-months they spent $22.8 billion, up from $13.4 billion.
For more information about S&P Dow Jones Indices, please visit www.spdji.com.
S&P Dow Jones Indices | ||||||||
S&P 500, $ U.S. BILLIONS | (preliminary and estimates in bold) | |||||||
PERIOD | MARKET | OPERATING | AS REPORTED | DIVIDEND & | ||||
VALUE | EARNINGS | EARNINGS | DIVIDENDS | BUYBACKS | DIVIDEND | BUYBACK | BUYBACK | |
$ BILLIONS | $ BILLIONS | $ BILLIONS | $ BILLIONS | $ BILLIONS | YIELD | YIELD | YIELD | |
12 Mo Mar,'19 Prelim. | $23,618.59 | $1,286.88 | $1,129.39 | $464.46 | $823.17 | 1.97% | 3.49% | 5.45% |
12 Mo Mar,'18 | $22,495.97 | $1,129.94 | $986.49 | $428.09 | $575.30 | 1.90% | 2.56% | 4.46% |
2018 | $21,026.90 | $1,281.66 | $1,119.43 | $456.31 | $806.41 | 2.17% | 3.84% | 6.01% |
2017 | $22,821.24 | $1,066.00 | $940.86 | $419.77 | $519.40 | 1.84% | 2.28% | 4.12% |
2016 | $19,267.93 | $919.85 | $818.55 | $397.21 | $536.38 | 2.06% | 2.78% | 4.85% |
3/29/2019 Prelim. | $23,619 | $316.48 | $291.23 | $117.33 | $205.81 | 1.97% | 3.49% | 5.45% |
12/31/2018 | $21,027 | $293.82 | $242.91 | $119.81 | $222.98 | 2.17% | 3.84% | 6.01% |
9/30/2018 | $24,579 | $349.04 | $306.70 | $115.72 | $203.76 | 1.81% | 2.93% | 4.75% |
6/30/2018 | $23,036 | $327.53 | $288.55 | $111.60 | $190.62 | 1.89% | 2.80% | 4.69% |
3/29/2018 | $22,496 | $311.26 | $281.28 | $109.18 | $189.05 | 1.90% | 2.56% | 4.46% |
12/29/2017 | $22,821 | $288.93 | $230.12 | $109.46 | $136.97 | 1.84% | 2.28% | 4.12% |
9/29/2017 | $21,579 | $268.35 | $243.68 | $105.45 | $129.17 | 1.92% | 2.40% | 4.32% |
6/30/2017 | $20,762 | $261.39 | $231.40 | $104.01 | $120.11 | 1.96% | 2.41% | 4.37% |
3/31/2017 | $20,276 | $247.32 | $235.65 | $100.86 | $133.15 | 1.98% | 2.51% | 4.49% |
12/31/2016 | $19,268 | $240.11 | $207.93 | $103.82 | $135.29 | 2.06% | 2.78% | 4.85% |
9/30/2016 | $18,742 | $247.98 | $219.46 | $98.43 | $112.20 | 2.10% | 2.92% | 5.01% |
6/30/2016 | $18,193 | $222.77 | $201.79 | $98.30 | $127.50 | 2.14% | 3.22% | 5.36% |
3/31/2016 | $17,958 | $208.99 | $189.37 | $96.67 | $161.39 | 2.15% | 3.28% | 5.43% |
12/31/2015 | $17,900 | $201.95 | $163.76 | $99.39 | $145.88 | 2.14% | 3.20% | 5.33% |
9/30/2015 | $16,917 | $224.14 | $204.58 | $95.07 | $150.58 | 2.22% | 3.30% | 5.52% |
6/30/2015 | $18,219 | $230.84 | $201.35 | $94.45 | $131.56 | 2.03% | 3.04% | 5.07% |
3/31/2015 | $18,303 | $228.45 | $193.05 | $93.41 | $144.13 | 1.98% | 2.94% | 4.92% |
S&P Dow Jones Indices | |||||||
S&P 500 SECTOR BUYBACKS | |||||||
SECTOR $ MILLIONS | Q1,'19 | Q4,'18 | Q1,'18 | 12MoMar,'19 | 12MoMar,'18 | 5-YEARS | 10-YEARS |
Consumer Discretionary | $17,721 | $25,652 | $18,679 | $85,716 | $86,053 | $432,669 | $715,393 |
Consumer Staples | $9,786 | $9,588 | $7,257 | $35,978 | $43,620 | $212,712 | $436,881 |
Energy | $4,294 | $8,698 | $10,115 | $24,606 | $20,744 | $96,306 | $264,764 |
Financials | $42,845 | $45,641 | $33,802 | $159,097 | $128,772 | $573,422 | $777,330 |
Healthcare | $30,749 | $31,336 | $35,632 | $103,808 | $73,605 | $406,585 | $674,182 |
Industrials | $19,426 | $23,026 | $16,628 | $81,038 | $56,075 | $352,199 | $528,673 |
Information Technology | $67,986 | $61,298 | $63,424 | $283,088 | $154,795 | $840,666 | $1,283,882 |
Materials | $4,771 | $5,857 | $2,283 | $16,880 | $6,781 | $68,582 | $106,004 |
Real Estate | $409 | $1,480 | $883 | $3,293 | $4,153 | $8,779 | $8,779 |
Communication Services | $6,345 | $9,556 | $170 | $26,412 | $464 | $34,520 | $65,078 |
Utilities | $1,479 | $850 | $179 | $3,251 | $237 | $7,714 | $17,723 |
TOTAL | $205,811 | $222,980 | $189,051 | $823,168 | $575,299 | $3,034,155 | $4,878,688 |
S&P Dow Jones Indices | ||||||||
S&P 500 20 LARGEST Q1 2019 BUYBACKS, $ MILLIONS | ||||||||
Company | Ticker | Sector | Q1 2019 | 12-Months | 12-Months | 5-Year | 10-Year | Indicated |
Buybacks | Mar,'19 | Mar,'18 | Buybacks | Buybacks | Dividend | |||
$ Million | $ Million | $ Million | $ Million | $ Million | $ Million | |||
Apple | AAPL | Information Technology | $23,811 | $75,149 | $50,015 | $234,736 | $284,260 | $13,769 |
Oracle | ORCL | Information Technology | $10,001 | $35,307 | $7,428 | $66,641 | $93,779 | $3,445 |
Pfizer | PFE | Health Care | $8,865 | $15,000 | $6,063 | $39,703 | $72,808 | $8,189 |
Bank of America | BAC | Financials | $6,263 | $21,499 | $14,944 | $46,890 | $51,552 | $14,117 |
Cisco Systems | CSCO | Information Technology | $6,067 | $22,790 | $13,394 | $50,022 | $81,759 | $5,679 |
JPMorgan Chase | JPM | Financials | $5,091 | $20,403 | $17,249 | $59,556 | $78,246 | $10,478 |
Wells Fargo | WFC | Financials | $5,084 | $22,712 | $11,103 | $62,045 | $75,017 | $5,795 |
Microsoft | MSFT | Information Technology | $4,753 | $17,272 | $10,124 | $69,001 | $108,382 | $6,163 |
Citigroup | C | Financials | $4,413 | $16,093 | $15,544 | $50,256 | $53,683 | $1,791 |
Eli Lilly | LLY | Health Care | $3,500 | $6,551 | $1,400 | $10,045 | $12,519 | $7,995 |
Union Pacific | UNP | Industrials | $3,487 | $10,546 | $4,420 | $24,876 | $31,879 | $6,145 |
Amgen | AMGN | Health Care | $3,032 | $10,255 | $13,462 | $29,934 | $48,711 | $4,233 |
Alphabet | GOOGL | Communication Services | $3,025 | $9,927 | $5,892 | $22,419 | $23,337 | $0 |
UnitedHealth Group | UNH | Health Care | $3,002 | $4,852 | $3,468 | $14,579 | $28,367 | $9,587 |
Booking Holdings | BKNG | Consumer Discretionary | $2,773 | $8,025 | $2,336 | $15,325 | $16,859 | $4,199 |
Starbucks | SBUX | Consumer Discretionary | $2,714 | $11,831 | $4,259 | $21,289 | $23,828 | $6,159 |
Boeing | BA | Industrials | $2,574 | $8,605 | $9,987 | $38,655 | $43,246 | $0 |
Intel | INTC | Information Technology | $2,530 | $11,346 | $4,707 | $33,877 | $59,837 | $1,750 |
Johnson & Johnson | JNJ | Health Care | $2,206 | $6,630 | $4,460 | $35,129 | $56,735 | $3,609 |
Walgreens Boots Alliance | WBA | Consumer Staples | $2,201 | $5,816 | $7,288 | $16,439 | $22,373 | $5,588 |
Top 20 | $105,392 | $340,608 | $207,543 | $941,417 | $1,267,178 | $118,690 | ||
S&P 500 | $205,811 | $823,168 | $575,299 | $3,034,155 | $4,878,688 | $522,886 | ||
Top 20 % of S&P 500 | 51.21% | 41.38% | 36.08% | 31.03% | 25.97% | 22.70% | ||
S&P Dow Jones Indices | ||||
S&P 500 20 Largest Quarterly Buybacks, $ Millions, as of Q1 2019; Apple added | ||||
$ MILLIONS | QUARTER | COMPANY | SECTOR | |
$23,811 | Q1 2019 | Apple | Information Technology | 1 |
$22,908 | Q1 2018 | Apple | Information Technology | 2 |
$21,860 | Q2 2018 | Apple | Information Technology | 3 |
$21,162 | Q2 2006 | QUALCOMM | Information Technology | 4 |
$19,364 | Q3 2018 | Apple | Information Technology | 5 |
$18,036 | Q1 2014 | Apple | Information Technology | 6 |
$17,319 | Q3 2014 | Apple | Information Technology | 7 |
$16,413 | Q2 2013 | Apple | Information Technology | 8 |
$15,707 | Q3 2007 | International Business Machines | Information Technology | 9 |
$13,420 | Q3 2015 | Apple | Information Technology | 10 |
$12,852 | Q4 2013 | Johnson & Johnson | Healthcare | 11 |
$12,318 | Q4 2016 | Allergan plc | Healthcare | 12 |
$12,183 | Q2 2012 | Johnson & Johnson | Healthcare | 13 |
$11,480 | Q4 2016 | Apple | Information Technology | 14 |
$11,133 | Q4 2017 | Apple | Information Technology | 15 |
$10,776 | Q2 2016 | Apple | Information Technology | 16 |
$10,724 | Q2 2015 | Apple | Information Technology | 17 |
$10,723 | Q1 2016 | Home Depot | Consumer Discretionary | 18 |
$10,697 | Q1 2018 | Amgen | Healthcare | 19 |
$10,114 | Q4 2018 | Apple | Information Technology | 20 |
S&P Dow Jones Indices | ||||
S&P 500 Q1 2019 Buyback Report | ||||
SECTOR | DIVIDEND | BUYBACK | COMBINED | |
YIELD | YIELD | YIELD | ||
Consumer Discretionary | 1.38% | 3.11% | 4.49% | |
Consumer Staples | 3.36% | 1.77% | 5.13% | |
Energy | 3.85% | 2.06% | 5.90% | |
Financials | 2.41% | 5.06% | 7.46% | |
HealthCare | 1.81% | 2.97% | 4.78% | |
Industrials | 2.06% | 3.46% | 5.52% | |
Information Technology | 1.57% | 5.23% | 6.80% | |
Materials | 2.16% | 2.46% | 4.62% | |
Real Estate | 3.20% | 0.43% | 3.63% | |
Communications Services | 1.66% | 1.78% | 3.44% | |
Utilities | 3.29% | 0.35% | 3.64% | |
S&P 500 | 2.13% | 3.36% | 5.49% | |
Uses full values (unadjusted for float) | ||||
Dividends based on indicated; buybacks based on the last 12-months ending Q1,'19 | ||||
Share Count Reduction (SCR) | SCR | SCR |
(Y/Y diluted shares used for EPS) | >=4% | <=-4% |
Q1 2019 | 8.05% | 24.90% |
Q4 2018 | 8.45% | 18.71% |
Q3 2018 | 6.43% | 17.67% |
Q2 2018 | 6.20% | 15.60% |
Q1 2018 | 7.01% | 13.63% |
Q4 2017 | 6.83% | 15.06% |
Q3 2017 | 8.62% | 14.23% |
Q2 2017 | 10.00% | 14.00% |
Q1 2017 | 12.00% | 14.80% |
Q4 2016 | 10.48% | 19.35% |
Q3 2016 | 9.94% | 23.73% |
Q2 2016 | 10.48% | 26.61% |
Q1 2016 | 10.06% | 28.17% |
Q4 2015 | 9.48% | 25.81% |
Q3 2015 | 9.64% | 22.69% |
Q2 2015 | 9.04% | 21.08% |
Q1 2015 | 7.62% | 21.04% |
Q4 2014 | 6.04% | 21.33% |
ABOUT S&P DOW JONES INDICES
S&P Dow Jones Indices is the largest global resource for essential index-based concepts, data and research, and home to iconic financial market indicators, such as the S&P 500® and the Dow Jones Industrial Average®. More assets are invested in products based on our indices than products based on indices from any other provider in the world. Since Charles Dow invented the first index in 1884, S&P DJI has been innovating and developing indices across the spectrum of asset classes helping to define the way investors measure and trade the markets.
S&P Dow Jones Indices is a division of S&P Global (NYSE: SPGI), which provides essential intelligence for individuals, companies, and governments to make decisions with confidence. For more information, visit: www.spdji.com.
SOURCE S&P Dow Jones Indices
These press releases may also interest you
|
News published on and distributed by:


