
Subjects: SVY, ECO
Chemical Activity Barometer Softens As Pace Of Growth Slows
WASHINGTON, Aug. 28, 2018 /PRNewswire/ -- The Chemical Activity Barometer (CAB), a leading economic indicator created by the American Chemistry Council (ACC), was flat in August remaining at 122.14 on a three-month moving average (3MMA) basis. This continued a general softening trend since the first quarter. The barometer is up 3.8 percent year-over-year (Y/Y), a slower pace than of that earlier in the year and similar to that seen in the second half of 2017. The unadjusted CAB also was flat, and follows a 0.3 percent decline in July. August readings indicate gains in U.S. commercial and industrial activity well into the first quarter 2019, but at a slower pace as growth has turned over.
The Chemical Activity Barometer has four primary components, each consisting of a variety of indicators: 1) production; 2) equity prices; 3) product prices; and 4) inventories and other indicators.
Most production-related indicators in August were positive as were inventories. These were offset by a slip in equity prices and product and input prices which were mixed.
The diffusion index remained at 71 percent. This index marks the number of positive contributors relative to the total number of indicators monitored.
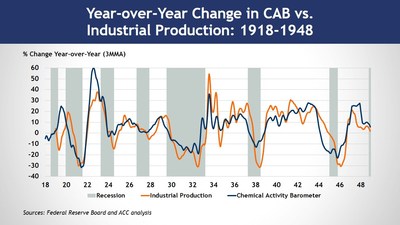
The Chemical Activity Barometer is a leading economic indicator derived from a composite index of chemical industry activity. The chemical industry has been found to consistently lead the U.S. economy's business cycle given its early position in the supply chain, and this barometer can be used to determine turning points and likely trends in the wider economy. Month-to-month movements can be volatile so a three-month moving average of the barometer is provided. This provides a more consistent and illustrative picture of national economic trends.
Applying the CAB back to 1912, it has been shown to provide a lead of two to fourteen months, with an average lead of eight months at cycle peaks as determined by the National Bureau of Economic Research. The median lead was also eight months. At business cycle troughs, the CAB leads by one to seven months, with an average lead of four months. The median lead was three months. The CAB is rebased to the average lead (in months) of an average 100 in the base year (the year 2012 was used) of a reference time series. The latter is the Federal Reserve's Industrial Production Index.
Chemical Activity Barometer for the Latest Six Months and Year-Ago Month*
|
Aug-17 |
Mar-18 |
Apr-18 |
May-18 |
Jun-18 |
Jul-18 |
Aug-18 | |
|
CAB (3 MMA) |
117.71 |
121.85 |
121.97 |
122.02 |
122.06 |
122.14 |
122.14 |
|
% M/M |
0.1 |
0.4 |
0.1 |
0.0 |
0.0 |
0.1 |
0.0 |
|
% Y/Y |
3.4 |
4.4 |
4.1 |
4.0 |
3.9 |
3.9 |
3.8 |
|
CAB |
117.88 |
121.99 |
122.11 |
121.97 |
122.30 |
121.97 |
122.01 |
|
% M/M |
0.1 |
0.1 |
0.1 |
-0.1 |
0.3 |
-0.3 |
0.0 |
|
% Y/Y |
3.2 |
4.0 |
4.1 |
3.8 |
4.1 |
3.6 |
3.5 |
|
*Percentage changes may not reflect index values due to rounding. |
The CAB comprises indicators relating to the production of chlorine and other alkalies, pigments, plastic resins and other selected basic industrial chemicals; chemical company stock data; hours worked in chemicals; publicly sourced, chemical price information; end-use (or customer) industry sales-to-inventories; and several broader leading economic measures (building permits and new orders). Each month, ACC provides a barometer number, which reflects activity data for the current month, as well as a three-month moving average. The CAB was developed by the economics department at the American Chemistry Council.
The next CAB is currently planned for:
25 September 2018
9:00 a.m. Eastern Time
The CAB is designed and prepared in compliance with ACC's Antitrust Guidelines and FTC Safe Harbor Guidelines; does not use company-specific price information as input data; and data is aggregated such that company-specific and product-specific data cannot be determined.
Note: Every effort has been made in the preparation of this publication to provide the best available information. However, neither the American Chemistry Council, nor any of its employees, agents or other assigns makes any warranty, expressed or implied, or assumes any liability or responsibility for any use, or the results of such use, of any information or data disclosed in this material.
SOURCE American Chemistry Council
These press releases may also interest you
|
News published on and distributed by:


