
Subjects: ERN, CCA, DIV
Atento Reports Fiscal 3Q17 Results Highlighted by Strong Topline and EPS Growth
NEW YORK, Oct. 31, 2017 /PRNewswire/ --
- Strong Multisector growth and continued improvement in revenue mix:
- Consolidated revenues up 9.0%, multisector up 15.3%
- Multisector broad-based gains in all regions, with mix up 420bps to 62.0%
- Revenue mix from higher value-added solutions up 230bps to 27.0%
- Telefonica revenues stable YoY
- Adjusted EBITDA margin of 11.9% in Q3 and YTD at 11.5%, in line with FY 2017 guidance
- Solid growth in recurring EPS, up 20% in Q3 and 12.8% YTD, to $0.24 and $0.53 respectively
- Sound Free Cash Flow generation and enhanced capital structure:
- Free cash flow before interest and acquisitions totalled $48 million, an 80% cash conversion
- Debt refinance estimated to reduce interest expense by $10-15mm p.a. as of 2018
- Net leverage down to 1.5x from 1.9x in Q3 2016 and 1.8x in Q2 2017
- Declares first cash dividend of $25.0 million ($0.34/share), under the approved policy
- Reaffirmed full-year 2017 targets
Atento S.A. (NYSE: ATTO), the largest provider of customer-relationship management and business-process outsourcing services in Latin America, and among the top five providers globally, today announced its third-quarter 2017 operating results. All comparisons in this announcement are year-over-year and in constant-currency (CCY), unless noted otherwise.
Summary
|
($ in millions except EPS) |
Q3 2017 |
Q3 2016 |
CCY |
YTD 2017 |
YTD 2016 |
CCY | |||
|
Income Statement |
|||||||||
|
Revenue (1) |
501.3 |
443.7 |
+9.0% |
1,443.0 |
1,315.5 |
+4.8% | |||
|
Adjusted EBITDA (3) |
59.7 |
60.5 |
-3.6% |
165.8 |
163.3 |
-3.4% | |||
|
Adjusted EBITDA Margin(3) |
11.9% |
13.6% |
-1.7pp |
11.5% |
12.4% |
-0.9pp | |||
|
Recurring Net Income (2) |
17.6 |
14.5 |
+19.7% |
39.1 |
33.1 |
+13.7% | |||
|
Recurring Earnings Per Share (2) |
$0.24 |
$0.20 |
+20.0% |
$0.53 |
$0.45 |
+12.8% | |||
|
Reported EBITDA (2) |
54.4 |
49.4 |
+7.7% |
150.8 |
132.7 |
+8.3% | |||
|
Reported Net Income/(Loss) (2) |
(12.0) |
(0.5) |
n.m. |
(6.9) |
(13.4) |
n.m. | |||
|
Reported Earnings Per Share (2) |
($0.16) |
($0.05) |
n.m. |
($0.09) |
($0.22) |
n.m. | |||
|
Cashflow, Debt and Leverage |
|||||||||
|
FCF before Interest and Acquisitions (3) |
47.6 |
46.7 |
53.3 |
52.9 |
|||||
|
Net Debt |
342.9 |
436.0 |
|||||||
|
Leverage (x) |
1.5x |
1.9x |
1.5x |
1.9x |
|||||
|
(1) |
Revenue excludes Morocco which was divested in September 2016. Please refer to the MD&A section of the Q3 2017 6K for more details. |
|
(2) |
Reported Net Income and Earnings Per Share and Adjusted EBITDA, Adjusted EBITDA Margin and Adjusted Earnings Per Share refer only to continuing operations. Reported and Adjusted Earnings Per Share, for the period ended September 30, 2017, were calculated considering the weighted average number of ordinary shares of 73,909,056. For the period ended September 30, 2016, the number of ordinary shares was 73,786,225. Recurring Earnings and EPS attributable to Owners of the parent |
|
(3) |
EBITDA is defined as profit/(loss) for the period from continuing operations before net finance costs, income taxes and depreciation and amortization. Adjusted EBITDA is defined as EBITDA adjusted to exclude restructuring costs, site relocation costs and other items not related to our core results of operations. EBITDA and Adjusted EBITDA are not measures defined by IFRS. The most directly comparable IFRS measure to EBITDA and Adjusted EBITDA is profit/(loss) for the year/period from continuing operations. |
|
(4) |
We define Free Cash flow before interest and acquisitions as operating cashflow minus Capex payments and income tax expenses. |
Alejandro Reynal, Atento's Chief Executive Officer, commented, "We delivered solid third quarter results, driven by strong growth in revenues and significant improvement in revenue mix from higher value-added solutions. Our confidence in the outlook of our business and the strength of our cash flow and balance sheet led Atento's Board to adopt a new dividend policy and declare the Company's first dividend payment, a new and important milestone in our trajectory as a listed company."
Mauricio Montilha, Atento's Chief Financial Officer, said, "Our proactive cost and efficiency initiatives allowed us to deliver stable margins along with strong top line results. Our focus on disciplined capital allocation, improving returns and strict working capital management drove an 80% adjusted EBITDA to cash conversion in the quarter. Our strong cash flow profile and low leverage of 1.5x reflect our enhanced financial flexibility."
Mr. Reynal concluded, "Our ongoing focus on driving the optimal balance of growth, profitability and liquidity provides us with the confidence to reaffirm our full-year outlook for revenue growth between 5% and 8% and adjusted EBITDA margin between 11% and 12%. I am confident in our ability to deliver above-market growth, further increase our leadership position in Latin America, and continue to be the reference partner for the CRM BPO needs of our clients."
Third Quarter Consolidated Operating Results
All comparisons in this announcement, unless otherwise noted, are year-over-year and in constant-currency (CCY).
We continue to present positive revenue trend, with consolidated revenue in constant currency up 9.0%, driven by the relevant growth in Brazil and Americas. Revenues from multisector grew a strong 15.3%, supported by new service/client wins in all regions and by the recent acquisitions. As a percentage of revenues, multisector increased 420 basis points year-over-year to a record 62.0% in Q3 2017. Revenues from Telefonica showed stability in the quarter as lower volumes in Mexico, Spain and Brazil were offset by higher volumes in Argentina, Chile and Colombia. The revenue mix from higher value-added solutions increased 230 basis points to a historical high of 27.0% in the quarter. On a reported basis, total revenue increased 11.1%.
Recurring net income and EPS attributable to owners of the parent in the quarter totaled $17.6 million and $0.24, respectively, with EPS up 20.0% helped by the decline in interest expense due to the debt refinancing. In Q3 2017, Adjusted EBITDA reached $59.7 million, implying an 11.9% margin. Year-to-date, Adjusted EBITDA totaled $165.8 million with margins at 11.5%, in line with the FY 2017 guidance. Adjusted EBITDA margin in the quarter was impacted by the ramp up of new clients.
Operating cash flow totaled $65.5 million in the quarter, and free cash flow before interest and acquisitions totaled $47.6 million, with Adjusted EBITDA to cash conversion of 79.7% in the quarter.
At the end of the third quarter, the Company had a cash position of $163.0 million with a net debt of $342.9 million. Net Debt to adjusted EBITDA presented reduction to 1.5x from 1.9x in Q3 2016 and 1.8x in Q2 2017.
Adjusted earnings, adjusted EBITDA and adjusted earnings per share are non-GAAP financial measures and are reconciled to their most directly comparable GAAP measures in the accompanying financial tables.
Segment Reporting
|
($ in millions) |
Q3 2017 |
Q3 2016 |
CCY |
YTD 2017 |
YTD 2016 |
CCY |
|
Brazil Region |
||||||
|
Revenue |
248.5 |
217.2 |
+11.4% |
720.3 |
601.9 |
+7.5% |
|
Operating Income |
11.4 |
15.1 |
-26.5% |
43.5 |
32.5 |
+25.0% |
|
Adjusted EBITDA |
32.1 |
33.1 |
-6.0% |
95.1 |
85.1 |
+1.8% |
|
Margin |
12.9% |
15.2% |
13.2% |
14.1% |
||
|
Americas Region |
||||||
|
Revenue |
198.4 |
179.8 |
+10.4% |
557.5 |
546.1 |
+3.3% |
|
Operating Income |
7.8 |
12.5 |
-38.1% |
25.0 |
41.4 |
-39.2% |
|
Adjusted EBITDA |
23.7 |
24.2 |
-2.8% |
62.9 |
71.9 |
-12.6% |
|
Margin |
11.9% |
13.5% |
11.3% |
13.2% |
||
|
EMEA Region |
||||||
|
Revenue |
55.1 |
47.1 |
-4.2% |
166.9 |
168.7 |
-0.5% |
|
Operating Income/(Loss) |
(2.4) |
(1.5) |
+50.0% |
0.7 |
(7.1) |
-109.9% |
|
Adjusted EBITDA |
3.5 |
4.7 |
-29.3% |
11.6 |
11.0 |
+4.8% |
|
Margin |
6.4% |
10.0% |
7.0% |
6.5% |
Brazil Region
Revenues in Brazil continued to present significant growth, up 11.4% in Q3 2017, primarily driven by an increase of 18.3% in revenues from multisector supported by new contract wins in new services, as well as the run rate from the acquisitions. Revenues from Telefonica decreased 1.8% in the quarter, driven by volume reductions. As a percentage of revenues, multisector increased 410 basis points to a record of 69.9% in Q3 2017, while revenue mix from higher value-added solutions reached 37.5%, up 80 basis points year-over-year. On a reported basis, revenues increased 14.4% in Q3 2017.
Operating Income was $11.4 million, while Adjusted EBITDA totaled $32.1 million, with margins at 12.9%, down 230 basis points. Decrease in margins was mainly reflected by new clients' implementation costs and higher labor contingencies.
Americas Region
Revenues in Americas returned to present growth in the quarter, up 10.4% primarily driven by positive results in Argentina, Chile and Colombia. Revenues from multisector grew by 14.0%, while revenues from Telefonica increased 5.6% in Q3 2017.
The region also presented improvement in the mix of revenues in the quarter. As a percentage of revenues, multisector reached 58.8% in Q3 2017, up 220 basis points, while mix of revenue from higher value-added solutions continued the growth trend, up 570 basis points to historical high of 18.0%. On a reported basis, revenues increased 10.3% in Q3 2017.
Operating income was $7.8 million, and Adjusted EBITDA was $23.8 million, implying adjusted EBITDA margin of 11.9%. Decrease in margins was driven by ramp up costs from new contracts in Colombia, Chile and U.S Nearshore, as well as due to volume adjustments from some clients in Mexico.
EMEA Region
Revenue in EMEA decreased 4.2% in Q3 2017, driven by 1.3% growth in multisector reflecting new client wins, which was offset by a 7.3% decrease in revenues from Telefonica, on the back of lower volumes in Spain. The mix of revenue from higher value-added solutions remained stable at 11.0%.
Operating loss was $2.4 million in Q3 2017, and Adjusted EBITDA totaled $3.5 million, with margin of 6.4%. The decrease in margin was mainly driven by the lower volumes from Telefonica.
Strong Balance Sheet and Debt Refinancing Enhances Financial Flexibility
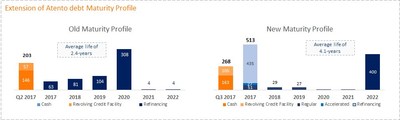
As of September 30, 2017, the Company had Cash and Cash equivalents of $163.0 million and undrawn revolving credit facilities of $105 million, implying total liquidity of $268.0 million. Total net debt with third parties was $342.9 million and last twelve month (LTM) adjusted EBITDA to net debt with third parties was 1.5x compared to 1.9x at September 30, 2016 and 1.8x at June 30, 2017.
As announced on September 18, 2017, the Company concluded the refinancing of its debt structure in the quarter. The process included the previously announced issuance of new $400 million Senior Secured Notes ("SSN"), the redemption in full of the Company's outstanding Senior Secured Notes due 2020 ($300 million), the redemption in full of the Brazilian Debenture due 2019 ($129 million), as well as the arrangement of new $105 million in Revolving Credit Facilities. As part of its refinancing process, the Company incurred a one-time net gain in cash of approximately $24.4 million, stemming from a $46.0 million gain from unwind hedging instruments related to the old bond, partially offset by $21.6 million expenses related to the refinancing.
Reflecting the debt refinance, we expect to reduce interest expense by $10-15mm p.a. as of 2018, with the full impact kicking in by Q4 2017.
Reaffirmed Fiscal 2017 Guidance
We continue on track with our strategy to allow us to deliver a return to both top and bottom line growth in Fiscal 2017, generate free cash flow, continue to outperform the market, further increase our leadership position in Latin America, and remain the reference partner for the CRM BPO needs of our clients. Year-to-date, revenues are in line with the provided guidance.
We reaffirm our outlook for Fiscal 2017:
|
Guidance | |
|
Consolidated Revenue Growth (CCY) |
5% to 8% |
|
Adjusted EBITDA Margin Range (CCY) |
11% to 12% |
|
Net Interest Expense Range |
$55MM to $60MM |
|
Cash Capex (% of Revenue) |
~3-4% |
|
Effective Tax Rate |
~39% |
|
Diluted Share Count |
~73.9MM shares |
|
Cash Conversion as % of Adj. EBITDA |
~40% |
This guidance assumes no change in the current operating environment, capital structure or exchange rates movements on the translation of our financial statements into U.S. dollars except where noted.
Dividends
In October 31, 2017, the board of Directors approved the payment of interim cash dividends, in the total amount of $25 million, which represents a $0.34 per common share of the company and a Dividend Yield of 2.8% (closing price as of October 30, 2017). The record date was set at November 10, 2017, and payment date is expected to be November 28, 2017.
Conference Call
The Company will host a conference call and webcast on Wednesday, November 1, 2017 at 10:00 am ET to discuss its financial results. The conference call can be accessed by dialing: +1 (877) 407-3982 toll free domestic, UK: (+44) 0 800 756 3429 toll free, Brazil: (+55) 0 800 891 6221 toll free, or Spain: (+34) 900 834 236 toll free. All other international callers can access the conference call by dialing: +1 (201) 493-6780 toll free. No passcode is required. Individuals who dial in will be asked to identify themselves and their affiliations. The live webcast of the conference call will be available on Atento's Investor Relations website at investors.atento.com. A web-based archive of the conference call will also be available at the above website.
About Atento
Atento is the largest provider of customer relationship management and business process outsourcing (CRM BPO) solutions in Latin America, and among the top five providers globally, based on revenues. Atento is also a leading provider of nearshoring CRM/BPO services to companies that carry out their activities in the United States. Since 1999, the company has developed its business model in 13 countries where it employs 150,000 people. Atento has over 400 clients to whom it offers a wide range of CRM/BPO services through multiple channels. Atento's clients are mostly leading multinational corporations in sectors such as telecommunications, banking and financial services, health, retail and public administrations, among others. Atento's shares trade under the symbol ATTO on the New York Stock Exchange (NYSE). In 2016, Atento was named one of the World's 25 Best Multinational Workplaces by Great Place to Work® for a fourth consecutive year. For more information visit www.atento.com
Forward-Looking Statements
This press release contains forward-looking statements. Forward-looking statements can be identified by the use of words such as "may," "should," "expects," "plans," "anticipates," "believes," "estimates," "predicts," "intends," "continue" or similar terminology. These statements reflect only Atento's current expectations and are not guarantees of future performance or results. These statements are subject to risks and uncertainties that could cause actual results to differ materially from those contained in the forward-looking statements. These risks and uncertainties include, but are not limited to, competition in Atento's highly competitive industries; increases in the cost of voice and data services or significant interruptions in these services; Atento's ability to keep pace with its clients' needs for rapid technological change and systems availability; the continued deployment and adoption of emerging technologies; the loss, financial difficulties or bankruptcy of any key clients; the effects of global economic trends on the businesses of Atento's clients; the non-exclusive nature of Atento's client contracts and the absence of revenue commitments; security and privacy breaches of the systems Atento uses to protect personal data; the cost of pending and future litigation; the cost of defending Atento against intellectual property infringement claims; extensive regulation affecting many of Atento's businesses; Atento's ability to protect its proprietary information or technology; service interruptions to Atento's data and operation centers; Atento's ability to retain key personnel and attract a sufficient number of qualified employees; increases in labor costs and turnover rates; the political, economic and other conditions in the countries where Atento operates; changes in foreign exchange rates; Atento's ability to complete future acquisitions and integrate or achieve the objectives of its recent and future acquisitions; future impairments of our substantial goodwill, intangible assets, or other long-lived assets; and Atento's ability to recover consumer receivables on behalf of its clients. In addition, Atento is subject to risks related to its level of indebtedness. Such risks include Atento's ability to generate sufficient cash to service its indebtedness and fund its other liquidity needs; Atento's ability to comply with covenants contained in its debt instruments; the ability to obtain additional financing; the incurrence of significant additional indebtedness by Atento and its subsidiaries; and the ability of Atento's lenders to fulfill their lending commitments. Atento is also subject to other risk factors described in documents filed by the company with the United States Securities and Exchange Commission.
These forward-looking statements speak only as of the date on which the statements were made. Atento undertakes no obligation to update or revise publicly any forward-looking statements, whether as a result of new information, future events or otherwise.
SELECTED FINANCIAL DATA
The following selected financial information should be read in conjunction with the interim consolidated financial statements and the section entitled "Management's Discussion and Analysis of Financial Condition and Results of Operations" presented elsewhere in the Form 6-K.
|
Consolidated Income Statements for the Three and Nine Months Ended September 30, 2016 and 2017 | |||||||||||||||
|
($ in millions, except percentage changes) |
For the three |
Change |
Change |
For the nine months |
Change |
Change | |||||||||
|
2016 |
2017 |
2016 |
2017 |
||||||||||||
|
(unaudited) |
(unaudited) |
||||||||||||||
|
Revenue |
443.7 |
501.3 |
13.0 |
10.9 |
1,315.5 |
1,443.0 |
9.7 |
4.8 | |||||||
|
Other operating income |
1.9 |
4.8 |
N.M. |
N.M. |
3.4 |
13.9 |
N.M. |
N.M. | |||||||
|
Operating expenses: |
|||||||||||||||
|
Supplies |
(16.8) |
(20.8) |
23.8 |
20.9 |
(47.0) |
(55.1) |
17.2 |
12.7 | |||||||
|
Employee benefit expenses |
(323.6) |
(369.1) |
14.1 |
12.1 |
(980.4) |
(1,070.0) |
9.1 |
4.5 | |||||||
|
Depreciation |
(11.6) |
(14.4) |
24.1 |
21.0 |
(34.4) |
(37.3) |
8.4 |
1.9 | |||||||
|
Amortization |
(13.4) |
(15.2) |
13.4 |
10.1 |
(37.5) |
(41.1) |
9.6 |
3.8 | |||||||
|
Changes in trade provisions |
(0.1) |
- |
(100.0) |
(100.0) |
(0.4) |
- |
(100.0) |
(100.0) | |||||||
|
Other operating expenses |
(55.7) |
(61.8) |
11.0 |
8.6 |
(158.4) |
(181.0) |
14.3 |
8.0 | |||||||
|
Total operating expenses |
(421.2) |
(481.3) |
14.3 |
12.2 |
(1,258.1) |
(1,384.5) |
10.0 |
5.1 | |||||||
|
Operating profit |
24.4 |
24.8 |
1.6 |
- |
60.8 |
72.4 |
19.1 |
14.9 | |||||||
|
Finance income |
2.3 |
2.4 |
4.3 |
4.3 |
4.4 |
6.0 |
36.4 |
22.4 | |||||||
|
Finance costs |
(22.0) |
(34.5) |
56.8 |
52.7 |
(59.8) |
(68.0) |
13.7 |
7.6 | |||||||
|
Change in fair value of financial |
(0.1) |
(2.4) |
N.M. |
N.M. |
0.6 |
(2.6) |
N.M. |
N.M. | |||||||
|
Net foreign exchange gain/(loss) |
(2.5) |
(3.2) |
28.0 |
33.3 |
(15.3) |
(4.2) |
(72.5) |
(72.5) | |||||||
|
Net finance expense |
(22.3) |
(37.7) |
69.1 |
65.4 |
(70.1) |
(68.8) |
(1.9) |
(5.8) | |||||||
|
(Loss)/profit before tax |
2.1 |
(12.9) |
N.M. |
N.M. |
(9.3) |
3.6 |
(138.7) |
(136.0) | |||||||
|
Income tax benefit/(expense) |
(2.6) |
2.8 |
N.M. |
N.M. |
(4.1) |
(8.3) |
102.4 |
97.6 | |||||||
|
Loss from continuing operations |
(0.5) |
(10.1) |
N.M. |
N.M. |
(13.4) |
(4.7) |
(64.9) |
(66.9) | |||||||
|
Discontinued operations: |
|||||||||||||||
|
Loss from discontinued operations |
(3.2) |
- |
(100.0) |
(100.0) |
(3.2) |
- |
(100.0) |
(100.0) | |||||||
|
Loss for the period |
(3.7) |
(10.1) |
N.M. |
N.M. |
(16.6) |
(4.7) |
(71.7) |
(73.3) | |||||||
|
(Loss)/profit attributable to: |
|||||||||||||||
|
Owners of the parent |
(3.8) |
(12.0) |
N.M. |
N.M. |
(16.7) |
(6.9) |
(58.7) |
(60.8) | |||||||
|
Non-controlling interest |
0.1 |
1.9 |
N.M. |
N.M. |
0.1 |
2.2 |
N.M. |
N.M. | |||||||
|
Other financial data: |
|||||||||||||||
|
EBITDA (1) (unaudited) |
49.4 |
54.4 |
10.1 |
7.7 |
132.7 |
150.8 |
13.6 |
8.3 | |||||||
|
Adjusted EBITDA (1) (unaudited) |
60.5 |
59.7 |
(1.3) |
(3.6) |
163.3 |
165.8 |
1.5 |
(3.4) | |||||||
|
(1) For reconciliation with IFRS as issued by IASB, see section "Summary Historical Consolidated Financial Information - Reconciliation of EBITDA and | |||||||||||||||
|
N.M. means not meaningful | |||||||||||||||
|
Reconciliation of EBITDA and Adjusted EBITDA to profit/(loss): | ||||||||
|
For the three months ended |
For the nine months ended | |||||||
|
($ in millions) |
2016 |
2017 |
2016 |
2017 | ||||
|
(unaudited) | ||||||||
|
Loss from continuing operations |
(0.5) |
(10.1) |
(13.4) |
(4.7) | ||||
|
Net finance expense |
22.3 |
37.7 |
70.1 |
68.8 | ||||
|
Income tax expense |
2.6 |
(2.8) |
4.1 |
8.3 | ||||
|
Depreciation and amortization |
25.0 |
29.6 |
71.9 |
78.4 | ||||
|
EBITDA (non-GAAP) (unaudited) |
49.4 |
54.4 |
132.7 |
150.8 | ||||
|
Restructuring costs (a) |
6.2 |
1.3 |
19.1 |
10.2 | ||||
|
Site relocation costs (b) |
0.7 |
- |
6.5 |
- | ||||
|
Other (c) |
4.2 |
4.0 |
5.0 |
4.8 | ||||
|
Total non-recurring items (*) |
11.1 |
5.3 |
30.6 |
15.0 | ||||
|
Adjusted EBITDA (non-GAAP) (unaudited) |
60.5 |
59.7 |
163.3 |
165.8 | ||||
|
(*) |
We define non-recurring items as items that are limited in number, clearly identifiable, unusual, are unlikely to be repeated in the near future in the ordinary course of business and that have a material impact on the consolidated results of operations. Non-recurring items can be summarized as demonstrated below: | |
|
a) |
Restructuring costs for the three and nine months ended September 30, 2016 and 2017 are compounded of two main concepts: i) investments to lower our variable cost structure, which is mostly labor and ii) investments to drive a more sustainable lower-cost and competitive operating model. Both were direct response to the exceptional and severe adverse macroeconomic conditions in key markets such as Spain, Argentina and Brazil, which drove significant declines in volume. | |
|
b) |
Site relocation costs incurred for three and nine months ended September 30, 2016 are related to the investments in Brazil, to relocate and consolidate our sites from higher to lower costs locations. This program started in 2014 when 53 percent of our sites were in Tier 2 cities. We have not invested in this program for the three and nine months ended September 30, 2017 as it was substantially completed in 2016. | |
|
c) |
Other non-recurring items for three and nine months ended September 30, 2016 refer mainly to other costs with the sale of Morocco operation related to the accrual of the reserve in amount of $3.1 million as guarantee to the buyer for potential indemnity related to eventual liability assessed from the period before the sale. For 2017 non-recurring items relates mostly to the recognition of the costs incurred or expected to be incurred to recover the operations in Mexico and Puerto Rico affected by recent natural disasters. These estimated costs of $3.2 million are related to third quarter of 2017 and includes costs that were incurred but could not be charged to customers (mainly salaries and benefits) and other extraordinary costs related to the natural disasters. | |
|
Reconciliation of Adjusted Earnings to profit/(loss): | |||||||
|
For the three months ended September 30, |
For the nine months ended September 30, | ||||||
|
($ in millions) |
2016 |
2017 |
2016 |
2017 | |||
|
(unaudited) | |||||||
|
Loss from continuing operations |
(0.5) |
(10.1) |
(13.4) |
(4.7) | |||
|
Amortization of acquisition related intangible assets (a) |
6.5 |
5.7 |
17.9 |
16.8 | |||
|
Restructuring costs (b) (*) |
6.2 |
1.3 |
19.1 |
10.2 | |||
|
Site relocation costs (c) (*) |
0.7 |
- |
6.5 |
- | |||
|
Other (d) (*) |
4.2 |
4.0 |
5.0 |
4.8 | |||
|
Net foreign exchange gain on financial instruments (e) |
0.1 |
2.4 |
(0.6) |
2.6 | |||
|
Net foreign exchange impacts (f) |
2.5 |
3.2 |
15.3 |
4.2 | |||
|
Financial non-recurring (g) |
- |
17.7 |
- |
17.7 | |||
|
Depreciation non-recurring (h) |
- |
2.8 |
- |
2.8 | |||
|
Tax effect (i) |
(5.1) |
(7.4) |
(16.6) |
(13.0) | |||
|
Total of add-backs |
15.1 |
29.7 |
46.6 |
46.1 | |||
|
Adjusted Earnings (non-GAAP) (unaudited) |
14.6 |
19.6 |
33.2 |
41.4 | |||
|
Adjusted basic Earnings per share (in U.S. dollars) (**) (unaudited) |
0.20 |
0.27 |
0.45 |
0.56 | |||
|
Adjusted Earnings attributable to Owners of the parent (non-GAAP) (unaudited) |
14.5 |
17.6 |
33.1 |
39.1 | |||
|
Adjusted basic Earnings per share attributable to Owners of the parent (in U.S. dollars) (**) (unaudited) |
0.20 |
0.24 |
0.45 |
0.53 | |||
|
(*) We define non-recurring items as items that are limited in number, clearly identifiable, unusual, are unlikely to be repeated in the near future in the ordinary | ||
|
a) |
Amortization of acquisition related intangible assets represents the amortization expense of customer base, recorded as intangible assets. This customer base represents the fair value (within the business combination involving the acquisition of control of Atento Group) of the intangible assets arising from service agreements (tacit or explicitly formulated in contracts) with Telefónica Group and with other customers. | |
|
b) |
Restructuring costs for the three and nine months ended September 30, 2016 and 2017 are compounded of two main concepts: i) investments to lower our variable cost structure, which is mostly labor and ii) investments to drive a more sustainable lower-cost and competitive operating model. Both were direct response to the exceptional and severe adverse macroeconomic conditions in key markets such as Spain, Argentina and Brazil, which drove significant declines in volume. | |
|
c) |
Site relocation costs incurred for three and nine months ended September 30, 2016 are related to the investments in Brazil, to relocate and consolidate our sites from higher to lower costs locations. This program started in 2014 when 53 percent of our sites were in Tier 2 cities. We have not invested in this program for the three and nine months ended September 30, 2017 as it was substantially completed in 2016. | |
|
d) |
Other non-recurring items for three and nine months ended September 30, 2016 refer mainly to other costs with the sale of Morocco operation related to the accrual of the reserve in amount of $3.1 million as guarantee to the buyer for potential indemnity related to eventual liability assessed from the period before the sale. For 2017 non-recurring items relates mostly to the recognition of the costs incurred or expected to be incurred to recover the operations in Mexico and Puerto Rico affected by recent natural disasters. These estimated costs of $3.2 million are related to third quarter of 2017 and includes costs that were incurred but could not be charged to customers (mainly salaries and benefits) and other extraordinary costs related to the natural disasters. | |
|
e) |
Since April 1, 2015, the Company designated the foreign currency risk on certain of its subsidiaries as net investment hedges using financial instruments as the hedging items. As a consequence, any gain or loss on the hedging instrument, related to the effective portion of the hedge is recognized in other comprehensive income (equity) as from that date. The gains or losses related to the ineffective portion are recognized in the income statements. For comparability, these adjustments are added back to calculate Adjusted Earnings. | |
|
f) |
Since 2015, our management analyzes the Company financial condition performance excluding net foreign exchange impacts, which eliminates the volatility of foreign exchange variances from our operational results. | |
|
g) |
Financial non-recurring relates to the costs incurred in the debt refinance process occurred in August 2017, which includes: (i) 2020 Senior Secured Notes call premium of $11.1 million and amortization of issuance costs of $4.9 million; (ii) Brazilian debentures due 2019 penalty fee of $0.7 million and remaining balance of the issuance cost of $1.0 million (See Note 13 to the interim consolidated financial statements). | |
|
h) |
Non-recurring depreciation relates to the provision for accelerated depreciation of fixed assets in Puerto Rico and Mexico, due to the recent natural disasters (See "Cautionary note regarding forward looking statements"). | |
|
i) |
The tax effect represents the impact of the taxable adjustments based on tax nominal rate by country. | |
|
(**) Adjusted Earnings per share is calculated based on the weighted average number of ordinary shares outstanding of 73,909,056 as of September 30, 2017. | ||
|
Financing Arrangements | |||
|
As of September 30, | |||
|
($ in millions, except Net Debt/Adj. EBITDA LTM) |
2016 |
2017 | |
|
(unaudited) | |||
|
Cash and cash equivalents |
177.9 |
162.8 | |
|
Debt: |
|||
|
Senior Secured Notes |
297.4 |
393.8 | |
|
Brazilian Debentures |
211.8 |
22.5 | |
|
Contingent Value Instrument (a) |
24.0 |
- | |
|
Finance Lease Payables |
3.8 |
9.8 | |
|
Other Borrowings |
76.9 |
79.6 | |
|
Total Debt |
613.9 |
505.7 | |
|
Net Debt with third parties (b) (unaudited) |
436.0 |
342.9 | |
|
Adjusted EBITDA LTM (c) (non-GAAP) (unaudited) |
227.5 |
224.4 | |
|
Net Debt/Adjusted EBITDA LTM (non-GAAP) (unaudited) |
1.9x |
1.5x | |
|
a) |
The CVI was terminated on November 8, 2016. |
|
b) |
In considering our financial condition, our management analyzes Net debt with third parties, which is defined as total debt less cash and cash equivalents. Net debt with third parties is not a measure defined by IFRS and it has limitations as an analytical tool. Net debt with third parties is neither a measure defined by or presented in accordance with IFRS nor a measure of financial performance, and should not be considered in isolation or as an alternative financial measure determined in accordance with IFRS. Net debt is not necessarily comparable to similarly titled measures used by other companies. |
|
c) |
Adjusted EBITDA LTM (Last Twelve Months) is defined as EBITDA adjusted to exclude restructuring costs, site relocation costs, asset impairments and other items not related to our core results of operations. |
|
Free Cash Flow: | ||||
|
Q3 |
YTD | |||
|
Free Cash Flow (FCF) US$ MM |
2017 |
2016 |
2017 |
2016 |
|
Operating Cash Flow (1) |
65.5 |
68.9 |
105.5 |
125.1 |
|
Cash Capex (2) |
(13.1) |
(16.1) |
(37.3) |
(55.8) |
|
Income Tax Paid |
(4.8) |
(6.1) |
(14.9) |
(16.4) |
|
Free Cash Flow before Interest and Acquisitions |
47.6 |
46.7 |
53.3 |
52.9 |
|
Adj. EBITDA to Cash Conversion (%) |
79.7% |
77.2% |
32.1% |
32.4% |
|
Acquisitions |
- |
(8.6) |
(27.1) |
(8.6) |
|
Net Interest Paid (3) |
9.1 |
(14.0) |
(19.4) |
(50.1) |
|
Free Cash Flow (FCF) |
56.7 |
24.1 |
6.8 |
(5.8) |
|
(1) |
We define Operating Cash flow as Net Cash flow from/(used in) operating activities (as per 6K) adding back net interest and income tax expenses. |
|
(2) |
Does not consider acquisitions |
|
(3) |
Net interest paid includes $46.0 million gain from unwind hedging instruments related to the old bond, partially offset by $21.6 million expenses related to the refinancing. |
![]()
SOURCE Atento S.A.
These press releases may also interest you
|
News published on and distributed by:


